Bug #18528 2012-03-11 10:05
alrock
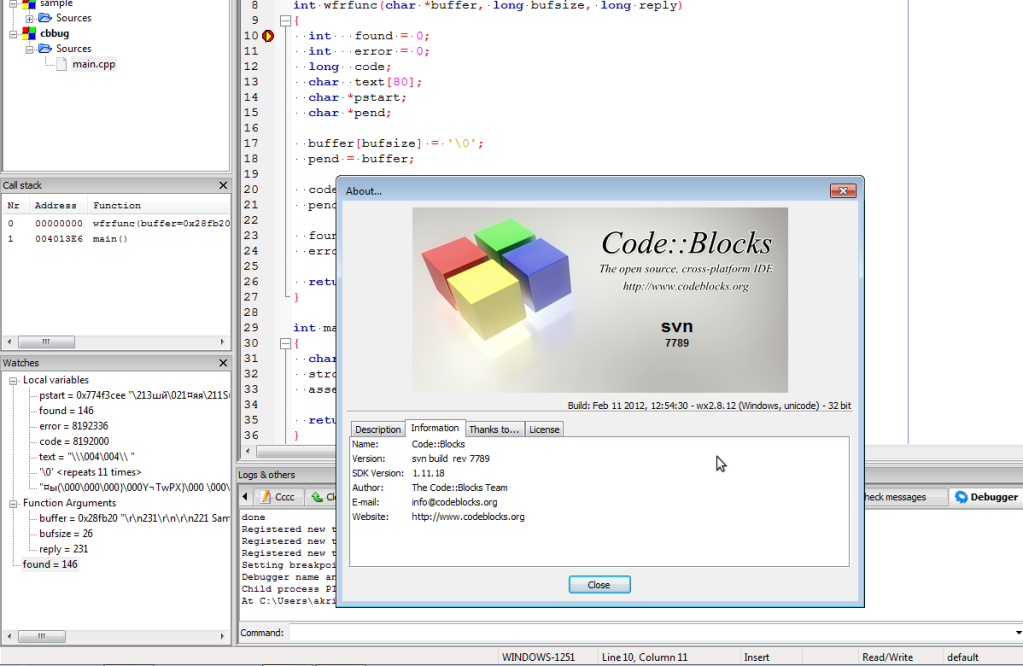
Incorrect variable list in Watches window
Seems that with some specific text in variable, the variables list displays bad. All next variables goes in the same line. For example: text = "some text here", next_var = "next_var value". See screenshot here: http://i41.tinypic.com/fegda9.png
- Category
- Debugger
- Group
- Platform:Windows
- Status
- Closed
- Close date
- 2013-10-04 22:19
- Assigned to
- tpetrov
History
Release 10.5 Build 6283, wx 2.8.10, Windows 7
Hi, First, I do not understand what your bug really means.
You C::B is too old, I suggest you try a more recent nightly version(especially the debugger branch nightly build), and test again. Also, if the bug still exist, then please post your test code and tell us how to reproduce this bug.
Ok, I've got 7789 build, result the same. You can use code below to reproduce this bug. When "step into" at "assert" line to wfrfunc function you should see that local variables list in Watches window looks incorrect.
And yes, sorry for my English.
#include <iostream>
#include <cstring>
#include <cassert>
#include <cstdlib>
using namespace std;
int wfrfunc(char *buffer, long bufsize, long reply)
{
int found = 0;
int error = 0;
long code;
char text[80];
char *pstart;
char *pend;
buffer[bufsize] = '\0';
pend = buffer;
code = strtol(pend, &pstart, 10);
pend = strstr(pstart, "/r/n");
found = (code == reply);
error = (code >= 400);
return found;
}
int main()
{
char buffer[1024];
strcpy(buffer, "\r\n231\r\n\r\n221 Sample code\r\n");
assert(wfrfunc(buffer, strlen(buffer), 231) > 0);
return 0;
}
Or just place breakpoint at first line of wfrfunc function.
It works OK on my system, WinXP, and latest c::b debugger branch, gdb cvs.
See the screen shot.
http://i683.photobucket.com/albums/vv194/ollydbg_cb/2012-03-15205806.png
My Watches window looks different. It should contain all local variables (6 in example code). See my screen shot:
http://i1175.photobucket.com/albums/r622/askalrive/ss-2012-03-16101322.png
Also, I tryed cb on Ubuntu, and it works Ok there.
Please use the debugger branch to test it. BTW: the "show local variables" feature was disabled in the debugger branch, because it will cause some crash problem and slow the step speed.
Ok, the bug could be closed if this feature was disabled.
Hi, alrock, Even the show local variable feature is disabled, you can still test it. Can you just add those variables you thought cause the bug to the watch list and see what happened.
To my knowledge, I think that the gdb output parser in debugger branch is much better than in normal trunk.
Also, some uninitiated local variables will be interpret badly by gdb, because gdb interprets them as normal variables, but as the memory is corrupt at this case, it will sometimes crash gdb.
This dialog has been replaced by a new one. Please retest and post here if the bug is still present, so we can fix it.
Closing for now.